Leveraging the database of Automate can be intimidating, especially for partners who don’t have previous database experience. With the release of our new plugin Database Commander, we wanted to create an introductory guide to using MySQL in Automate, and simultaneously demonstrate the features of the plugin. Please note that you can use any MySQL query editor with the following guide.
We’ve split each item above into its own post, and in this installment, we’re going to look at creating custom monitors. You can see all our MySQL 101 for Automate entries by clicking here.
Before we dive into MySQL, please note that we provide this content for informational purposes only. While we believe all the commands in this series are safe to run, please do so at your own risk. Automation Theory advises all partners to have good backups and to use a dedicated test environment wherever possible.
Creating custom monitors
An internal monitor in Automate is simply a MySQL query plus scheduling/alerting/exclusion logic. As a result, you can monitor anything in the database (and with scripts or custom tables you can put almost anything in the database).
For our example, let’s create a monitor that alerts when the same script is run on the same computer multiple times (something must not be working right). We’re going to use something known as a RAWSQL monitor, Automation Theory style.
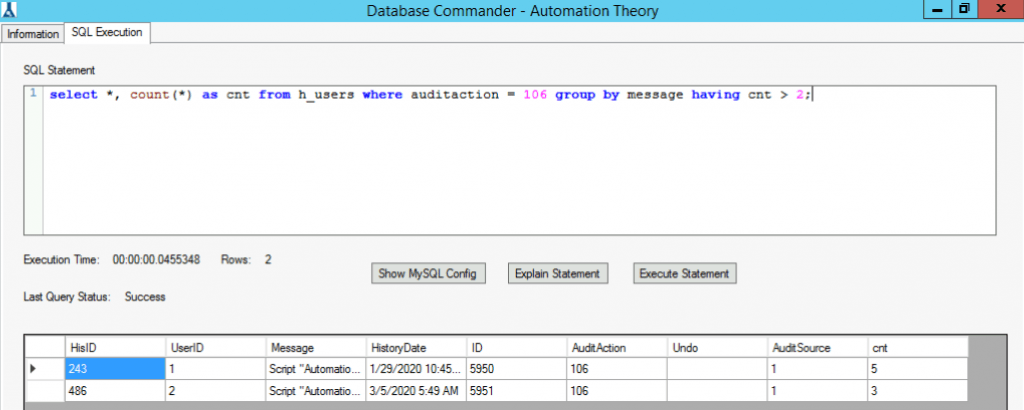
First, let’s isolate what we want. To pull running the same script multiple times by the same user we want to look in the h_users table for auditaction 106, grouping on the message (which is different for each computer) and the user running the script. We use a count function and a having clause together to only show the multiple attempts:
select *, count(*) as cnt from h_users where auditaction = 106 group by message having cnt > 2;
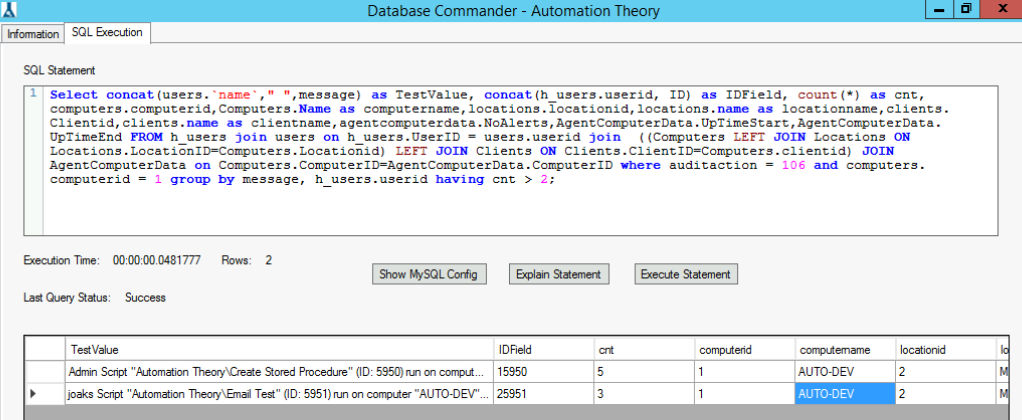
Now that we have our data, we need to massage it into a proper RAWSQL monitor format (the columns the application is expecting). Normally you’d probably be querying something with a computerid (event logs, processes, services, etc.) but for this example, we’re going to hard-code the ID to be computer 1. [Please change the computerid value to one that exists on your server as needed.]
The base query for a RAWSQL monitor can be found here. We’ll use our hard-coded computerid to join the other relational tables, as other monitoring/alerting functions will leverage those settings. The query is as follows:
Select concat(users.`name`," ",message) as TestValue, concat(h_users.userid, ID) as IDField, count(*) as cnt, computers.computerid,Computers.Name as computername,locations.locationid,locations.name as locationname,clients.Clientid,clients.name as clientname,agentcomputerdata.NoAlerts,AgentComputerData.UpTimeStart,AgentComputerData.UpTimeEnd FROM h_users join users on h_users.UserID = users.userid join ((Computers LEFT JOIN Locations ON Locations.LocationID=Computers.Locationid) LEFT JOIN Clients ON Clients.ClientID=Computers.clientid) JOIN AgentComputerData on Computers.ComputerID=AgentComputerData.ComputerID where auditaction = 106 and computers.computerid = 1 group by message, h_users.userid having cnt > 2;
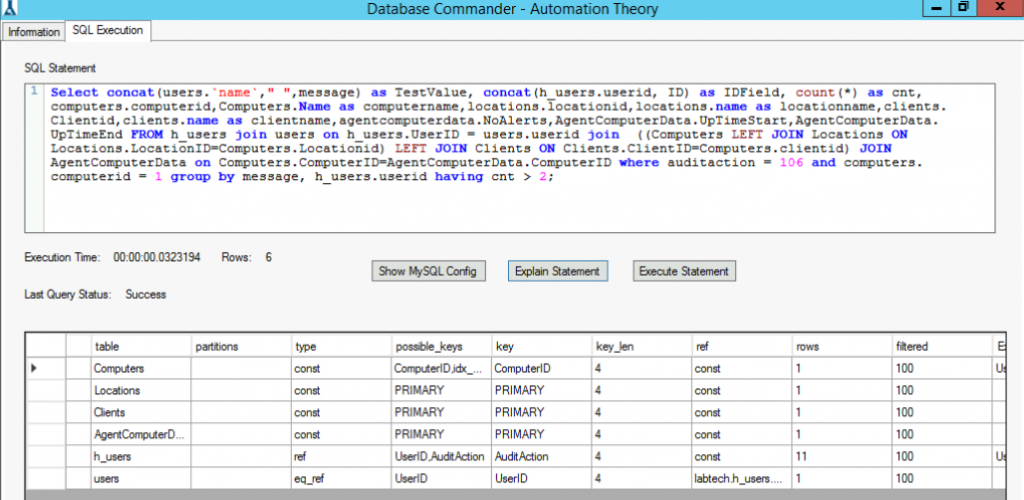
It’s normally not good practice to join unrelated tables (especially without using an on clause), but in this case the query is optimal; since we use a hard-coded computerid in the where clause every single join is using an index and uses 100% of the rows it filters (and of course we must do this for the application to function as expected).

At this point the query can be copy/pasted into an internal monitor and scheduling/alerting can be configured.
We hope that this installment has been helpful for you. Here at Automation Theory, we’re certified MySQL DBAs dedicated exclusively to the Connectwise Automate software stack. Be sure to check out our integrations and services.
